Method

Functional principal component analysis models

  • Method
  • Multidisciplinary Analysis

One goal of Ki is to discover phenotypic variation in growth trajectories. Functional Principal Component Analysis (FPCA) is a method for investigating the dominant modes of variation in functional data. In the context of growth modeling, FPCA uses non-parametric functions to characterize both the population mean growth trajectory and a collection of uncorrelated functions that describe principal directions of subject-specific deviation from the mean growth trajectory. For example, principal components could identify higher or lower initial growth velocities, or earlier or later growth deceleration patterns. By using a non-parametric approach, FPCA doesn’t impose a functional form on the data. Instead, FPCA allows the data to determine common axes of variations in growth trajectories.

WHAT IS FUNCTIONAL DATA ANALYSIS?

Information about curves, surfaces, or anything else that varies over a continuum, such as growth over time is called functional data.

Time series data are an example of functional data.[2] Functional data are often characterized by:

  • High-frequency measurements
  • An underlying “smooth” but complex process
  • Repeated observations
  • Multi-dimensionality

Functional data analysis (FDA) is a set of statistical tools that enables a more accurate summary and analysis of these types of data.[3]


WHAT IS FUNCTIONAL PRINCIPAL COMPONENT ANALYSIS?

Principal Component Analysis (PCA) is a statistical procedure used to investigate and characterize dominant modes of variation in multivariate data, called principal components, or principal modes of variation.[3] PCA is used across disciplines as a form of dimensionality reduction.[3]

Analogously, Functional Principal Component Analysis (FPCA) is a method for investigating and characterizing the dominant modes of variation in functional data.

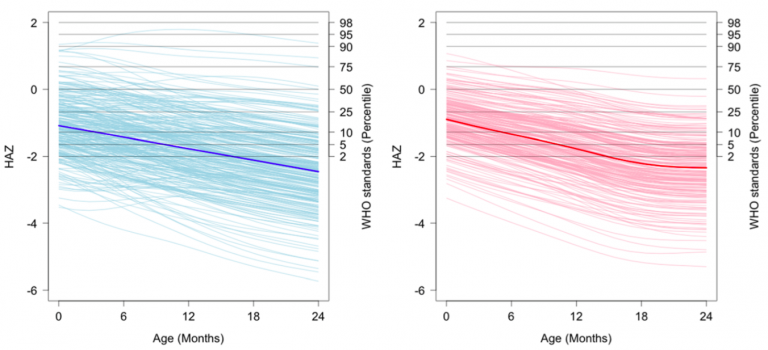
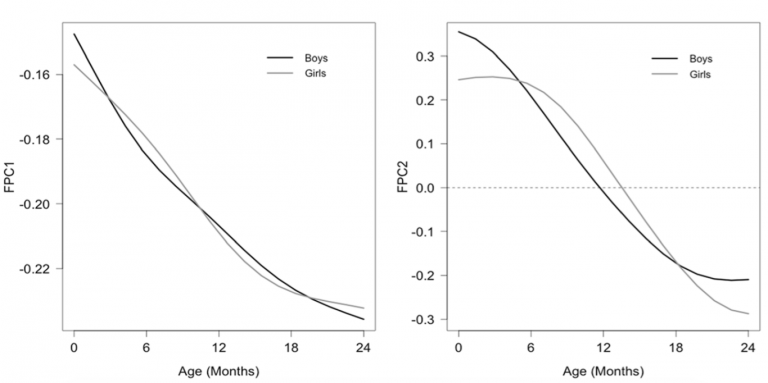
The visualization below (Figure 1) shows an example of FPCA inputs and output.[1]

FIGURE 1. An example of FPCA taken from Zhang et al.[1] In the top row of figures, the lighter curves show individually fit growth curves for height-for-age z-score (HAZ) from birth to 2-years. The mean curves are shown in the bolded curve. In contrast, the bottom figures show the two leading functional principal components of HAZ. One can see that the cross-sectional mean provides a poor summary of these HAZ curves compared to FPCA.

Advantages of FPCA

  • Flexible, data-driven approach for modeling growth trajectories and charactering patterns of variation in growth without imposing parametric functional form.[1, 4]

Disadvantages of FPCA

  • Best suited for data measured at a high frequency, although can be used with sparsely collected measures.
  • Can be difficult to interpret non-parametric functions which characterize functional variation.
  • Current methods do not easily allow for inclusion of covariate effects.
  • Modeling and simulation of trajectories beyond the range of observed data, with respect to time, is not advisable.

A few examples of Ki FPCA models include modeling longitudinal length for age z-score (LAZ) measures in a semiparametric model, longitudinal growth of length, weight, and head circumference for ages 0-1 year, and longitudinal fetal growth trajectories from ultrasound for gestational ages 14-43 weeks.

References

  1. Zhang Y, Zhou J, Niu F, Donowitz JR, Haque R, Petri WA, et al. Characterizing early child growth patterns of height-for-age in an urban slum cohort of Bangladesh with functional principal component analysis. BMC pediatrics. 2017;17(1):84.
  2. Ullah S, Finch C. Applications of functional data analysis: A systematic review. BMC Med Res Methodol2013.
  3. Ramsay J, Silverman B. Functional data analysis. 2nd ed. ed. New York: New York : Springer; 2005.
  4. Menglu C, Linglong K, Rhonda CB, Yan Y. Trajectory modeling of gestational weight: A functional principal component analysis approach. PLoS ONE.12(10):e0186761.

Share

Last Updated

October, 2020