Many types of data, such as growth curves, are not well approximated by linear relationships. Nonlinear models capture relationships that exist between predictor variable(s) and an outcome and can be useful if a linear model does not provide a good fit for the predictor-outcome relationship. Piecewise linear models are a set of methods that can be used to approximate non-linear curves.
Ki teams have used piecewise linear/”broken stick” methods for modeling longitudinal growth measures and and length-for-age z-scores. The models estimate measures of growth from birth to 2 years, and specify knots at 6, 12, and 18 months. These models also allow for incorporation of time-varying predictor effects, as well as both direct and lagged effects on growth velocities However, the models require careful selection of of age intervals during which growth velocity remains relatively constant.
In another analytic evaluation, Ki focused on fetal weight estimates. The estimation of fetal weight via ultrasound is commonly done using Hadlock formulas which require the following measures: biparietal diameter, head circumference, abdominal circumference, and femur length. Ki attempted to improve on the method by improving the linear model by incorporating fetal anthropometry measures from 14 weeks gestational age to birth.
WHAT ARE LINEAR MODELS?
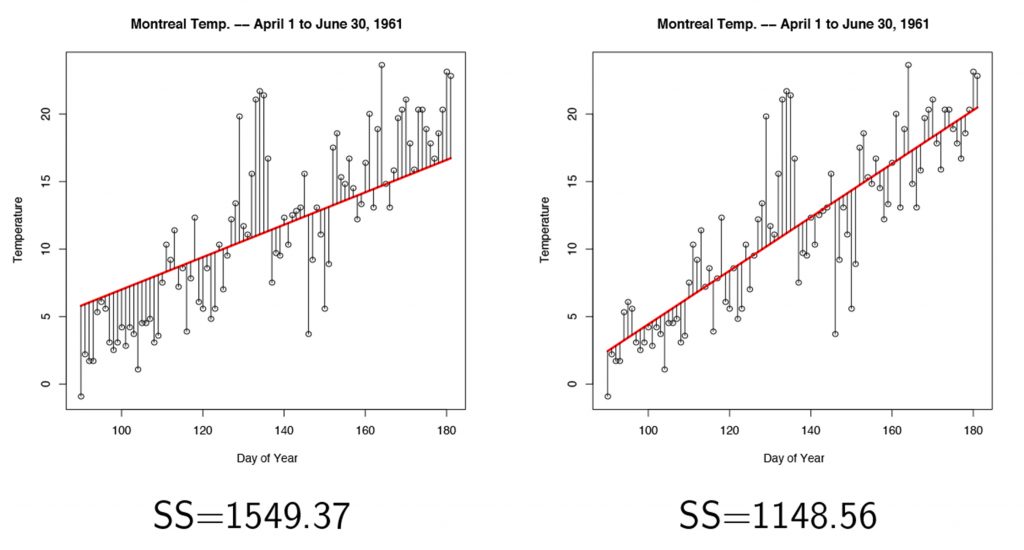
Linear regression methods can be used to summarize linear relationships between variables. In a simple linear regression, a line is fit across data points such that the slope of that line summarizes the relationship between an outcome variable and the predictor variable(s).
Ordinary Least Square (OLS) is the most commonly used method to determine the best fit line. This method chooses the best fit line as that which minimizes the squared vertical distance from each data point to the line (Figure 1).[1]
This method is typically applied in situations where you have a continuous outcome variable and a continuous predictor variable.
In some cases, linear regression can be used to summarize monotonic non-linear data, if transforming (e.g. log10, sqrt, etc.) the variable results in a linear relationship.[1]
Advantages of linear models
- Results are often easily interpretable.
- This method is most widely taught and understood across disciplines.
Disadvantages of linear models
- Limited in its ability to handle non-linear data and associations.
WHAT IS A PIECEWISE LINEAR MODEL?
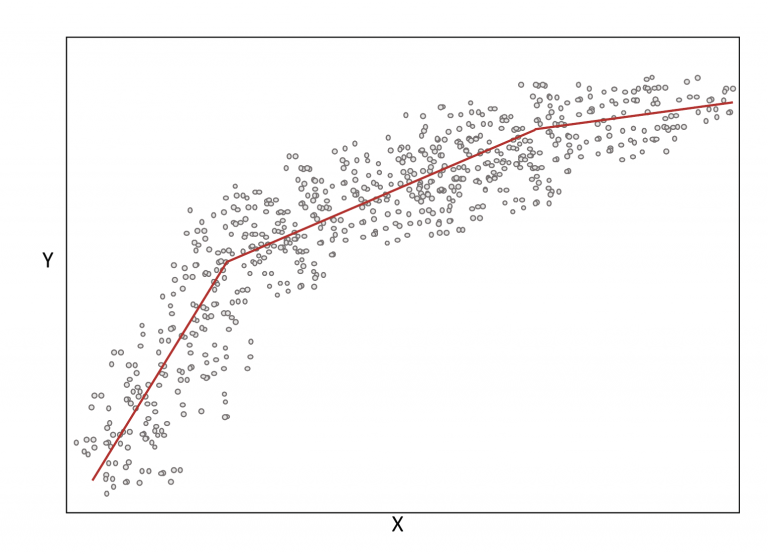
It is a regression-based method used to approximate non-linear relationships. This method is also sometimes referred to as linear splines, or a broken stick method.[1, 2]
A linear spline is a continuous function formed by connecting linear segments. The points where the segments connect are called the knots of the spline.[2]
Linear splines fit a linear regression to different segments of the data. These segments are defined by knots, or cut-points (see Figure 2).
Linear splines are examples of nonparametric models, meaning they do not make any assumptions about underlying distribution of the data (e.g. normality), and are referred to as a distribution-free.
Advantages of piecewise linear models
- This is a more flexible, data driven methodology. It also can be fit as a non-parametric model, meaning that few assumptions are required.
- Advantage over fitting a polynomial regression, quadratic or cubic splines in that the coefficients are more interpretable.
Disadvantages of piecewise linear models
- Results are highly sensitive to the location of the knots. The choice of appropriate knot locations has a large influence on the quality and interpretability of the solution.
- Selection of too many knots can lead to overfitting the model.
- Not realistic representation of a child’s growth because it is piecewise. Alternatively, if you used a smoothed spline model, the growth curves would appear more realistic.
WHY DOES Ki USE PIECEWISE LINEAR MODELS?
Many types of data, such as growth curves, are not well approximated by linear relationships. Nonlinear models capture relationships that exist between predictor variable(s) and an outcome and can be useful if a linear model does not provide a good fit for the predictor-outcome relationship. Piecewise linear models are a set of methods that can be used to approximate non-linear curves.
KI UTILIZATION OF LINEAR MODELS TO IMPROVE ON HADLOCK EQUATION
The Hadlock formulas are among the most common equations for calculating estimated fetal weight via ultrasound. These formulas require the following measures: biparietal diameter, head circumference, abdominal circumference, and femur length.
This purpose of this model is to explore possible improvements to the Hadlock equations and estimates fetal weight from 14 weeks GA to birth, using typical fetal anthropometry as predictors.
KI UTILIZATION OF PIECEWISE LINEAR / “BROKEN STICK” MODELS FOR LONGITUDINAL GROWTH MEASURES AND LENGTH-FOR-AGE Z-SCORES (LAZ)
These models estimate measures of growth from birth to 2 years, and specify knots at 6, 12, and 18 months. Care needs to be taken to select age intervals over which growth velocity is relatively constant.
These models also allow for incorporation of time-varying predictor effects, as well as both direct and lagged effects on growth velocities.

